New Study Reveals State-by-State Safety Benchmarks: Altitude by Geotab Presents Insights at TRB 2025
Learn about Geotab ITS’ rebrand to Altitude by Geotab and view our Digital Privacy white paper.

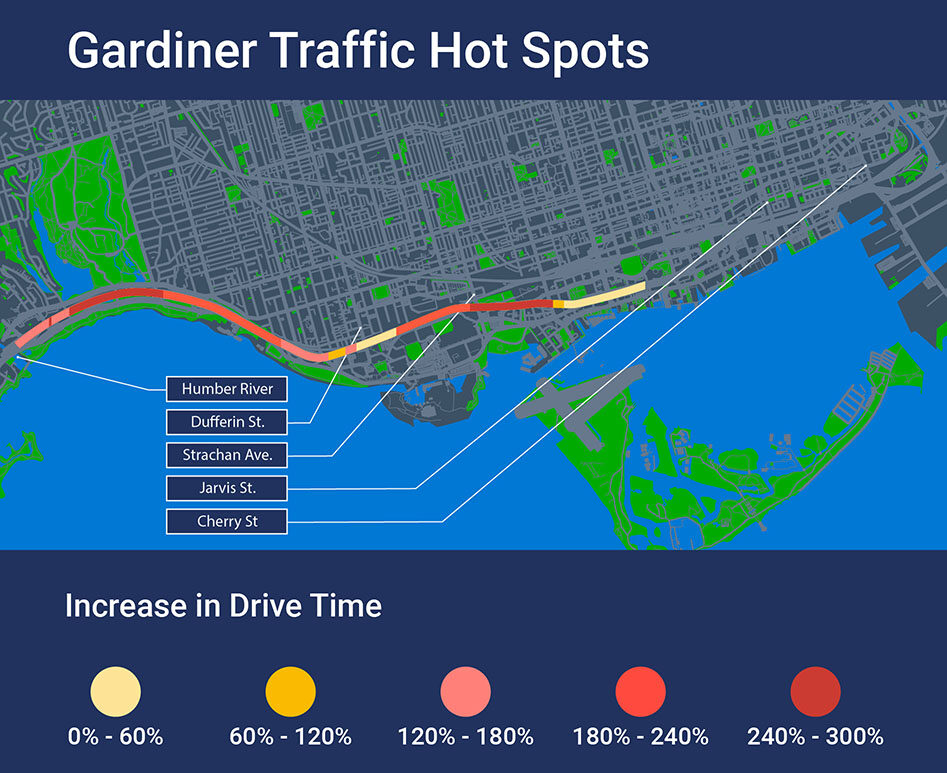
Toronto, Ontario (June 6, 2024) – The latest construction project on the Gardiner Expressway — a major transportation route which is traveled by approximately 140,000 vehicles each day — has already made an impact on driving time and emissions. An Altitude by Geotab study on commercial vehicle traffic on the Gardiner reveals that recent slowdowns due to construction are having an impact on business productivity in Toronto:
Since construction began on March 25, 2024, commercial vehicle drivers are spending more time on the road. Travel time in some areas of the Gardiner has doubled. Altitude by Geotab found that the average time to travel from the Humber River to Strachan Ave. increased from 8 minutes to 20 minutes, and the typical time to travel the 5 km stretch between Jarvis St. and Dufferin St. is now 25 minutes instead of 11 minutes.
During the morning rush hour, from 7-10 am, travel times on the Gardiner increased by up to 250% on the westbound lanes, as compared to pre-construction traffic. Travel times also increased by up to 230% on the Gardiner eastbound during the afternoon rush hour. Average drive times were most impacted around 8 am, as well as the 3 pm and 4 pm commuting hours.
On the Gardiner, commercial vehicle drivers are spending 80% more time driving per day on average compared to the pre-construction period. The rise in travel time is impacting business productivity. The increased drive time adds pressure particularly to last mile delivery companies, which are already facing demand challenges due to the growth in e-commerce.
The Toronto Region Board of Trade reports that traffic congestion costs over $11 billion in productivity losses each year, and impacts trade and productivity in the city. In 2023, there were 19 million annual commercial trips in the Toronto Core, representing 151 million kilometers driven.
Geotab’s recent State of Commercial Transportation examined overall productivity and looked at both the average number of trips per day, average driving duration per day and trip to hours ratio as proxies for gained (or lost) productivity by fleets. In this context, we see that commercial fleets have experienced decreased productivity due to the Gardiner closure. For commercial fleets, in addition to the potential impact to service, spending more time in traffic can add up in fuel costs. For every hour of idling, an engine wastes 3 litres of fuel.
Longer drive times on the Gardiner are increasing CO2 emissions from commercial vehicles. Increased driving time led to a 23% increase in emissions, equating to approximately an extra 1,200 kg of CO2 daily from the vehicles in the study — the same as the carbon footprint of a premium roundtrip flight from Toronto to Vancouver. As well, Altitude by Geotab identified a 26% increase in commercial vehicle idling time.
Traffic-related air pollution (TRAP) from cars, trucks and other vehicles is the largest source of air pollution in Toronto. Air pollution can have a negative impact on health and has been linked to respiratory and cardiovascular diseases and cancer, and increased levels of air pollution from traffic reaches up to 250 meters from a major road.
Other Toronto roadways have seen increased commercial traffic as drivers seek alternative routes. The top three roads most impacted by commercial traffic congestion, with an average increase of 43%, are:
Data insights were derived from Altitude, the aggregate transportation analytics platform from Altitude by Geotab, which provides contextualized insights on fleet and freight vehicle movement in an aggregate micro and macro picture. The analysis was based on over 10,000 commercial vehicles.
The Altitude platform provides crucial insights based on real-world trips to support safer, more efficient and more livable cities. Context-added transportation data is valuable because it provides deeper insight into overall regional vehicle movement, ultimately helping planners better understand vehicles’ diverse purposes and travel tendencies.
Our team of data science, AI, software engineering and user experience specialists has one purpose – helping transportation data stakeholders understand and act on the context behind their traffic data. Altitude by Geotab’s vision is to develop safer, more sustainable and equitable transportation networks for all through the intrinsic power of contextual commercial vehicle insights. We work closely with a variety of organizations in both the public and private sectors to help them achieve their transportation infrastructure and policy goals. Altitude by Geotab’s promotes economic prosperity and streamlined people and goods movement by supplying trustworthy, high-quality transportation insights.
We are dedicated to providing aggregate observed, real-world data so you can make more informed decisions to improve efficiency, sustainability, profitability and safety. For more information on Altitude by Geotab and the Altitude Platform, visit: altitude.geotab.com and follow us on LinkedIn.
Nicole Riddle
Senior Specialist, Strategic Communications
pr@geotab.com
Learn about Geotab ITS’ rebrand to Altitude by Geotab and view our Digital Privacy white paper.
Discover how factors like city size and temperature influence the idling and stopping patterns of delivery vehicles. Altitude by Geotab’s recent blog post dives into the data from six major cities, revealing interesting findings about door-to-door vehicle tendencies.