New Study Reveals State-by-State Safety Benchmarks: Altitude by Geotab Presents Insights at TRB 2025
Learn about Geotab ITS’ rebrand to Altitude by Geotab and view our Digital Privacy white paper.

We investigate how door-to-door delivery vehicles behave in different urban areas and demonstrate that the idling and stopping behavior of these vehicles is correlated with local weather and land area.
In the modern era, many people and businesses are accustomed to short wait times between making a purchase online and receiving the delivered product at their doors. The number of vehicles and drivers involved in this vocation has consistently increased over the last decade. Vehicles that participate in door-to-door delivery are distinguishable from other types of vocations by the frequency of their stops as well as the relatively short amount of time spent at each stop. In this article, we examined the driving behavior of door-to-door delivery vehicles in six cities across North America to understand how door-to-door delivery driving varies by location. We considered two metrics to understand the operations of these vehicles:
For door-to-door delivery vehicles, both time spent idling and time spent stopped may be representative of ‘deliveries’ because vehicles may not turn off their engines for all deliveries. In addition to these two metrics, we explored the correlation between:
We explore each of these metrics and correlations in the following cities:
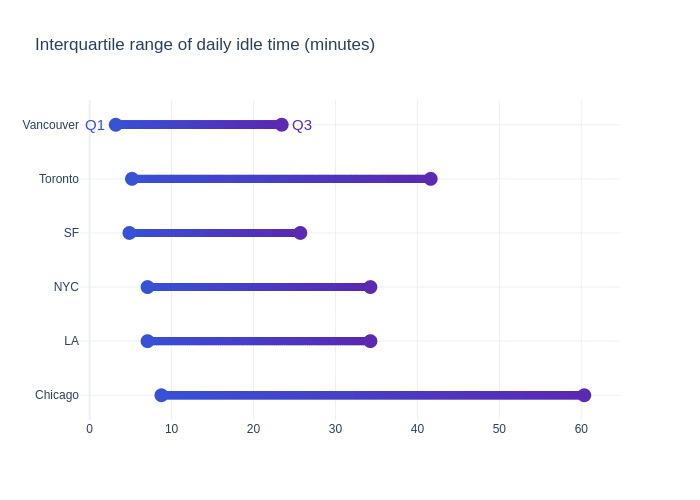
In order to understand how much time door-to-door vehicles spend idling on any given day, we calculated the interquartile range (IQR) of idle time. The interquartile range is defined as the range of values between the 25th percentile and the 75th percentile. This allows us to break down the typical ranges that door-to-door delivery vehicles spend idling by city. The plot below shows the IQR of idle time (in minutes) for each of the six cities we studied.

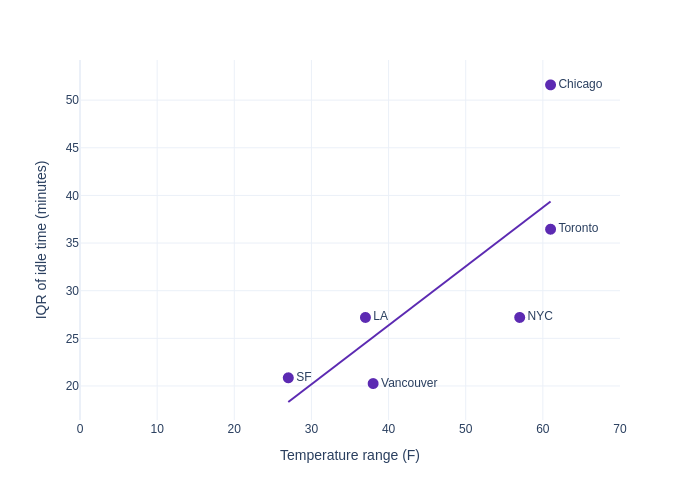
Chicago and Toronto have the longest IQRs, while the typical range of idle time is shorter in New York City and L.A. and even shorter in Vancouver and San Francisco. Because Toronto and Chicago (which have the longest idling IQRs) are well known for their cold winters, we investigated the relationship between idling IQR and typical annual temperature range. Our hypothesis is that wider ranges in temperature may result in longer idling time, as drivers may be inclined to leave the heat or air conditioning running while making deliveries. Our next plot shows temperate range (in degrees Fahrenheit) on the X-axis and idling range (in minutes) on the Y-axis. The linear regression model between temperature range and IQR of idle time has an R2 value of 0.59, which indicates that there is a relationship between the two variables – but temperature alone does not fully account for disparities in idling time among the different cities.
(Typical annual temperature range for each city is taken from historical data collected on weatherspark.com.)

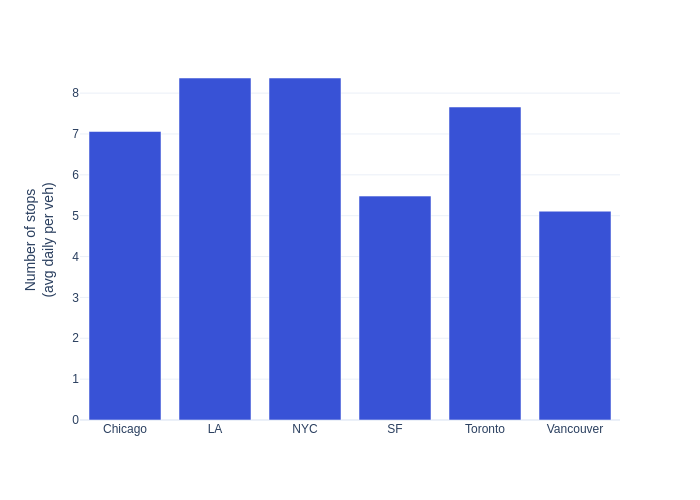
We explored the average daily number of full stopping events (defined by the engine being turned off) that door-to-door delivery vehicles participate in. The plot below shows the average daily number of stops per vehicle in each city. 
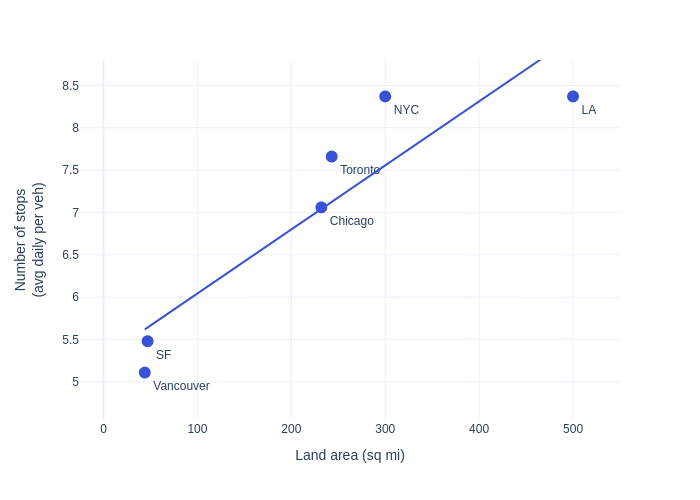
As the graph indicates, San Francisco and Vancouver have the fewest average daily number of stopping events. These two cities are also geographically smaller than the others considered in this study, so we investigated the relationship between number of stopping events and land area for each city. This relationship is demonstrated in the graph below. The linear regression model between land area and average daily number of stops has an R2 value of 0.83, which indicates that there is a strong relationship between the two variables. and area largely accounts for the difference in stop totals between each city.

To understand idling and stopping behavior of door-to-door delivery vehicles in six different North American cities, we relied on connected vehicle data from our Altitude platform. We attempted to understand why these vehicles behave differently in each city by measuring the correlation between idling and temperature as well as the relationship between number of stops and land area. Our analysis found that temperature does have an impact on idling behavior, but it alone does not fully explain why vehicles in different cities idle for varying amounts of time. We also observed that the number of daily stops made by vehicles is largely dependent on the land area of each city.
Discover more about Altitude and how our insights can enable you to create more efficient vehicle movement throughout your city by reaching out today.