New Study Reveals State-by-State Safety Benchmarks: Altitude by Geotab Presents Insights at TRB 2025
Learn about Geotab ITS’ rebrand to Altitude by Geotab and view our Digital Privacy white paper.


To set up a new business location for success and reduce financial risk, companies must initiate a careful commercial site selection process in advance. With thousands to millions of dollars invested any time new real estate is proposed, an organization can stand to lose a fortune if they choose a poor location. This article will explore what commercial site selection is, why it’s imperative before a new location is established or acquired and how transportation analytics streamline the process.
Commercial site selection is the process of using data and insights to pinpoint high-potential areas for a new business location. Insights like transportation analytics, demographic and median household income data can all help a commercial organization uncover where their ideal customer profile is geographically and place new business locations near them, priming them for a profitable result.
This process is important because it gives an organization’s leadership confidence in a project’s potential, generating buy-in and leading to more lucrative outcomes. Understanding what motivates your target buyer as well as how far they’re willing to travel for your business’s offering are additional important factors to consider when site selecting. For businesses like restaurant chains, retailers and downstream oil and gas companies, transportation insights are one of the most important types of data to study.
Altitude by Geotab provides detailed transportation analytics that can help you construct a strong business case for a new store location. Conversely, our insights can also help you identify areas where it’s wise to avoid building new locations or acquiring new land. Our data is contextualized, providing you with insight on commercial vehicle classes, types and vocations for even smarter site selection. Our transportation analytics additionally show you where these vehicles are most commonly coming from, where they’re going and the most frequent areas they’re stopping.
Origin & Destination Insights: Aggregated commercial vehicle travel insights paint the full picture of where your ideal customers are headed. Analyze O&D data to help prove a business location concept. Make an educated site decision based on where most buyers are headed as well as where they are driving from.
Route Analysis and Expansion Factors: Dig into driver preferences, journey totals and travel durations. See popular routes that vehicles take throughout a new area your business wants to expand into. Our Expansion Factors additionally provide insight into how the entire fleet population moves throughout an area, helping you accurately assess total regional vehicle movement trends.
Stop Analytics: Identify where most trucks usually stop while en route to their destinations. High-traffic rest areas provide a golden opportunity for new businesses such as fuel stations, convenience stores and restaurants to be built, as customers are already stopping at these areas. Pinpoint effective locations for new real estate accordingly.
Regional Travel Metrics: Analyze metrics like average annual daily traffic (AADT) counts to understand the total number of vehicles traveling through a region. Compare AADT metrics for different areas and choose higher volume ones for better business outcomes..
Transportation data guides better real estate site selection by backing choices up with evidence of consumer behaviors. Using insights around customer travel tendencies and preferences gives companies confidence that their projects will work.
Here are three primary examples of using transportation data for optimized site selection.
Example #1: Market Analysis
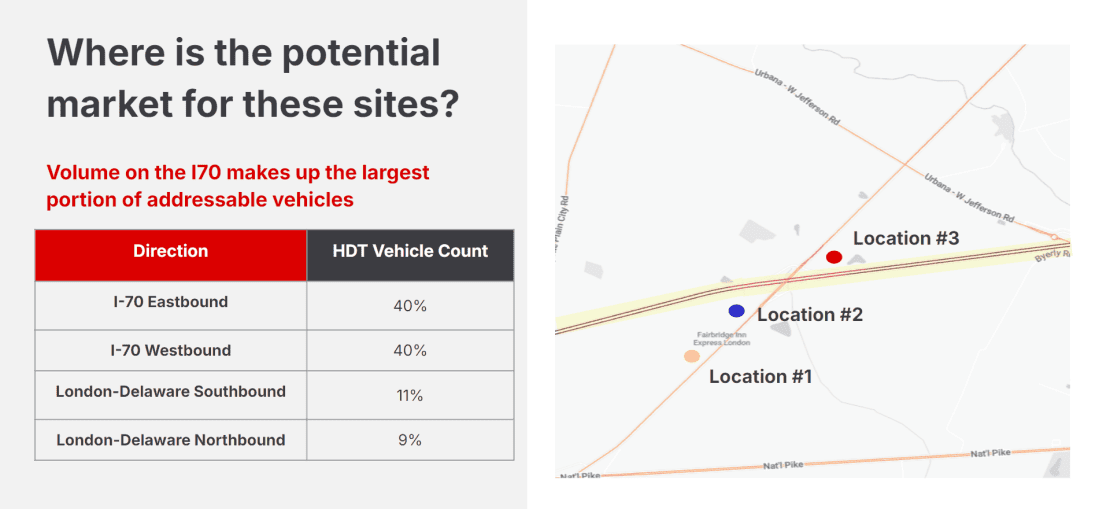
This map breaks down the potential addressable market for a new business location based on heavy-duty vehicle counts. Knowing which directions these vehicles are moving helps organizations such as fuel companies place new sites on the sides of the most traffic-heavy roads.
Example #2: Travel Volume Analysis
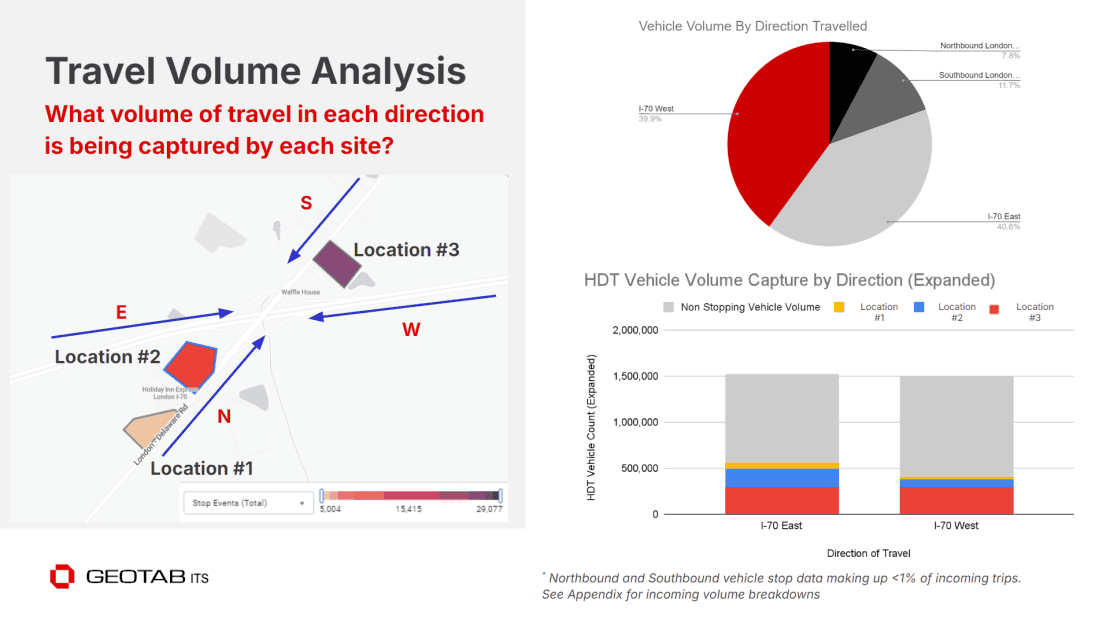
This visualization shows where traffic is heading in relation to three different sites and additionally highlights key differences in overall vehicle volume. The bar graphs detail the vehicle stop breakdowns at each location, helping a company understand how much traffic competing locations might be receiving compared to theirs.
Example #3 – Stop Locations
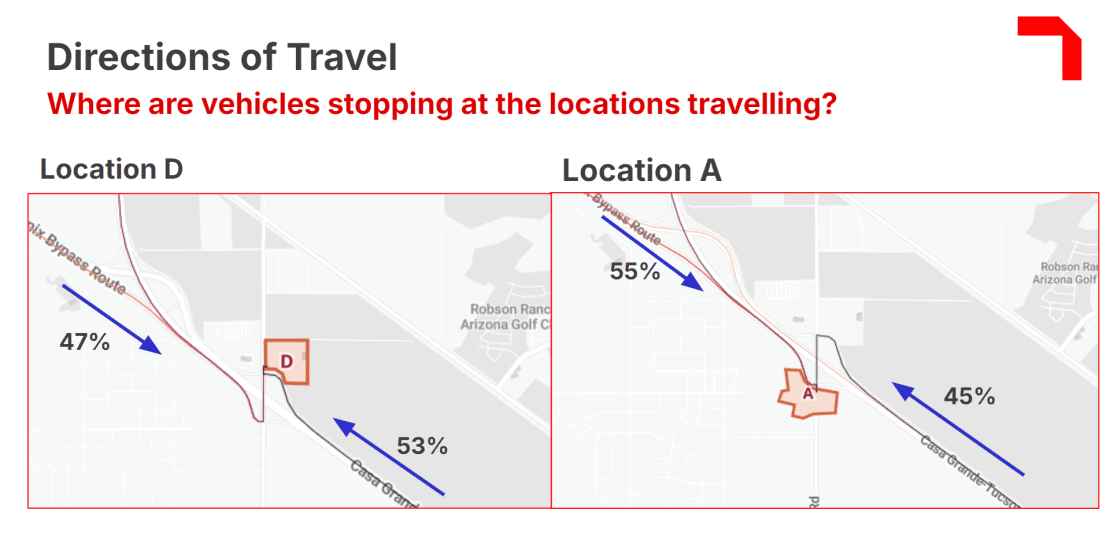
Maps showing the disparity in vehicle stops for two competing businesses’ locations along the same road. Location D is seeing a higher percentage of stops from vehicles traveling north westbound, while Location A is experiencing a higher share of stops for vehicles moving south eastbound. Knowing which direction of traffic is contributing to a majority of a location’s business helps companies better understand consumer behaviors and tailor their strategies accordingly.
When it comes to choosing your next business location, our data is worth the investment. Altitude by Geotab provides trustworthy, ultra-reliable transportation analytics that cover 99.9% of primary roadways in the U.S and Canada as well as 85% of secondary roadways. Our contextualized insights can be stratified into vehicle types, vocations, classes and more, giving you unparalleled depth of knowledge to support virtually any site selection project you’re working on. Reach out to us to learn how we can help set your next business location up for a profitable outcome.
Schedule a demo of our Altitude platform to learn about how our insights can guide you to a data-driven site selection strategy.
Learn about Geotab ITS’ rebrand to Altitude by Geotab and view our Digital Privacy white paper.
Discover how factors like city size and temperature influence the idling and stopping patterns of delivery vehicles. Altitude by Geotab’s recent blog post dives into the data from six major cities, revealing interesting findings about door-to-door vehicle tendencies.